In today’s data-driven world, organizations generate massive amounts of raw data daily. However, without proper analysis, this data remains unused. The ability to transform raw numbers into actionable insights helps businesses optimize decisions, improve efficiency, and gain a competitive advantage.
Key Challenges in the Data-to-Insights Journey
- Managing large and unstructured datasets
- Ensuring data quality and accuracy
- Choosing the right analytical tools
- Communicating results effectively
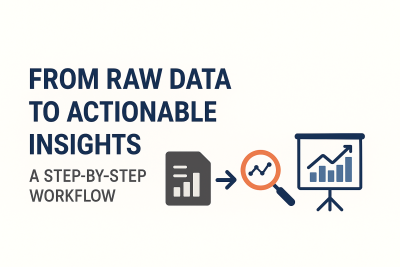
Step-by-Step Workflow: From Raw Data to Insights
Step 1: Define the Objective : Before collecting any data, you must clearly define what you want to achieve. What business question are you trying to answer? A vague goal like "increase sales" is not enough. Instead, frame a specific, measurable question, such as "Which marketing channels drive the most conversions in the first quarter?" Defining your objective gives your analysis a clear purpose and helps you focus on relevant data.
Step 2: Data Collection and Integration : This step involves gathering all the necessary data. Data can come from various sources, including sales records, customer surveys, social media metrics, and website analytics. Data integration is crucial here, as it involves combining these disparate datasets into a unified view. You might use tools with built-in connectors to pull data from different platforms seamlessly, ensuring you have a comprehensive picture.
Step 3: Data Cleaning and Preparation: This is often the most time-consuming yet critical step. Raw data is almost always messy and contains errors, duplicates, or missing values. Data cleaning involves identifying and rectifying these issues. You'll need to remove irrelevant data, correct inconsistencies, and handle missing information. The principle of "garbage in, garbage out" is highly relevant here; the quality of your insights directly depends on the cleanliness of your data.
Step 4: Data Analysis and Exploration : Once your data is clean and prepared, you can begin the actual analysis. This is where you use various techniques to find patterns, trends, and correlations. This step can involve:
- Descriptive Analysis: Summarizing the data to understand what has happened.
- Diagnostic Analysis: Investigating the root causes behind specific trends.
- Predictive Analysis: Using models to forecast future outcomes.
- Prescriptive Analysis: Recommending the best course of action. You can use a mix of statistical analysis, data mining, and machine learning models to explore the data from different angles.
Step 5: Data Visualization and Interpretation: Numbers and complex models can be difficult for a non-technical audience to understand. Data visualization transforms your findings into intuitive charts, graphs, and dashboards. This step makes it easier to interpret your results and communicate them effectively. Your visuals should tell a clear story, highlighting the key insights and answering the questions you defined in Step 1.
Step 6: Action and Feedback Loop: The final and most important step is to take action based on your insights. Your analysis is only valuable if it leads to a tangible business decision or change. After implementing your strategy, it's essential to monitor the results. This creates a feedback loop, where you can use new data to refine your analysis, improve your models, and continuously optimize your business processes.
Recommended Articles:
Comparative Analysis of Workflow Approaches
Manual vs. Automated Workflows
Manual Workflows: The Human Touch:
Manual workflows rely on human effort for every step of the data analysis process, from data entry to cleaning and reporting. This approach is most suitable for small datasets where data is collected infrequently. For instance, a small startup might manually enter a few hundred customer records into a spreadsheet for a one-time analysis.
Strengths:
- Flexibility: A person can quickly adapt to unexpected data formats or ad-hoc requests without needing to reprogram a system.
- Cost-Effective for small-scale projects: For businesses just starting out, manual work can be done using readily available tools like spreadsheets, with minimal investment in specialized software
Weaknesses:
- Time-Consuming: As data volume grows, manual workflows become extremely time-consuming. Hours are spent on repetitive tasks like data cleaning and preparation, taking valuable time away from actual analysis.
- Prone to Errors: Humans are susceptible to making mistakes, especially during repetitive tasks. A simple typo or a copy-paste error can compromise the entire analysis, leading to flawed insights.
- Not Scalable: Manual workflows cannot efficiently handle increasing data volume or a growing number of data sources. As the business expands, this approach becomes a major bottleneck.
Automated Workflows: The Scalable Solution
Automated workflows use specialized software and scripts to perform tasks with minimal human intervention. This approach is ideal for big data and for businesses that need to run analyses frequently and reliably. An automated workflow can automatically pull data from multiple sources, clean it, transform it, and generate reports on a schedule.
Strengths:
- Efficiency and Speed: Automation can process vast amounts of data in a fraction of the time it would take a human. This allows for near real-time insights, enabling faster decision-making.
- Higher Accuracy: Machines follow a consistent set of rules, which dramatically reduces the risk of human error. This leads to more reliable and accurate analysis.
- Scalability: Automated systems are built to scale. Whether your data volume doubles or you add new data sources, the workflow can be easily adjusted to handle the increased load without a drop in performance.
- Resource Optimization: By automating repetitive and tedious tasks, employees are freed up to focus on higher-value activities that require critical thinking and creativity, such as interpreting results and developing business strategy.
Cloud-Based vs. On-Premise Solutions
The choice between cloud-based and on-premise analytics is a fundamental decision that impacts everything from your budget to your data security. Each model has distinct advantages and disadvantages that make it suitable for different types of organizations.
Cloud-Based Analytics: The Modern, Agile Choice
Cloud-based solutions are hosted by a third-party provider and accessed over the internet. This model has become the default for many modern businesses due to its flexibility and ease of use.
Strengths:
- Flexibility and Scalability: Cloud platforms offer unparalleled scalability. You can easily and instantly scale your storage and processing power up or down to match your business needs, a feature often referred to as "elasticity." This means you only pay for the resources you use, which is highly cost-effective for businesses with fluctuating data volumes or seasonal demand.
- Collaboration: Cloud-based tools are designed for collaboration. Team members can access, share, and work on the same data from anywhere in the world, fostering a more connected and efficient workflow.
- Lower Upfront Costs: There's no need for a massive upfront investment in hardware, servers, and physical infrastructure. The subscription-based model turns what would be a significant capital expenditure (Capex) into a more manageable operating expense (OpEx).
- Managed Services: The cloud provider handles all maintenance, software updates, and hardware management. This frees up your internal IT team to focus on more strategic, business-critical tasks.
Potential Security Concerns: While reputable cloud providers invest heavily in security, the fact that your data is stored on a third-party server can be a source of concern. The main security risks often arise from misconfiguration (e.g., leaving a storage bucket publicly accessible) and a lack of control over the physical infrastructure. Organizations must have a clear understanding of the provider's security responsibilities and their own to protect sensitive data.
On-Premise Analytics: The Traditional, Controlled Approach
On-premise solutions are hosted on an organization's own servers and infrastructure, giving them complete physical and operational control over their data. This model is often favored by large enterprises in highly regulated industries.
Strengths:
- Greater Control: With on-premise, you have full control over your hardware, software, security protocols, and data. This level of autonomy is crucial for organizations with strict compliance or data privacy requirements.
- Enhanced Security (in a controlled environment): By keeping data within your own firewalls, you can minimize the risk of external breaches. For extremely sensitive data, this can provide a sense of security that a shared cloud environment might not offer.
- Lower Latency: Since data is stored and processed locally, there is no reliance on an internet connection, which can lead to faster data retrieval and analysis, especially for high-frequency operations.
Weaknesses:
- Higher Costs: This model requires a significant upfront investment in servers, software licenses, and physical infrastructure. You also have ongoing costs for maintenance, power, cooling, and a dedicated IT team to manage the system.
- Limited Scalability: Scaling up requires purchasing and installing new hardware, which is a slow, expensive, and inflexible process. You can't simply "add more space" for peak periods and then remove it; you must provision for your highest anticipated workload.
- Maintenance Burden: The responsibility for all software updates, security patches, and hardware maintenance falls entirely on your internal team, which can be a significant drain on resources.
The choice between these two models ultimately depends on a business's specific priorities: flexibility, scalability, and cost-efficiency (cloud) vs. control, security, and low latency (on-premise). Some organizations opt for a hybrid approach, storing their most sensitive data on-premise while leveraging the cloud for less critical workloads to get the best of both worlds.
Future Outlook: Evolving Data Workflows
AI-Powered Automation
AI and machine learning (ML) are set to transform the analytics landscape by automating many of the most time-consuming tasks. This isn't just about faster processing; it's about a fundamental shift in how analysis is performed.
- AI-powered automation will enable analysts to focus less on manual data preparation and more on strategic interpretation.
- AI algorithms will increasingly handle the tedious work of cleaning messy data, identifying and correcting errors, and filling in missing values. This will drastically reduce the time analysts spend on "data wrangling" and improve the overall quality of the datasets.
- Automated Modeling and Insights: ML models will automatically select the best statistical techniques for a given dataset and even generate insights without explicit instructions. For instance, an AI might automatically detect a hidden correlation between a marketing campaign and a surge in sales, providing an immediate, actionable insight.
- Predictive and Prescriptive Automation: AI will power more sophisticated predictive models that can forecast future trends with greater accuracy. Beyond that, it will drive prescriptive analytics, recommending specific, optimized courses of action—for example, automatically suggesting the best time to run a marketing campaign to maximize conversions.
- Self-Service Analytics: The goal of self-service analytics is to democratize data access and analysis, empowering a much broader range of employees to make data-driven decisions. In the past, generating a report often required a request to a dedicated team of data analysts, creating a bottleneck.
- User-Friendly Interfaces: Modern tools are being built with intuitive, drag-and-drop interfaces that allow non-technical users—such as marketers, sales managers, or HR professionals—to explore data on their own. They can create their own dashboards and reports without writing a single line of code.
- Empowering the Business User: This trend frees up data analysts to focus on more complex, high-level projects, while business users can get immediate answers to their daily questions. It promotes a more data-literate culture across the entire organization, leading to faster, more agile decision-making at every level.
- Governance and Control: While self-service is about freedom, it also requires proper governance. Tools are evolving to provide IT and data teams with the ability to control data access and ensure users are working with validated, secure data sources to prevent errors.
Integration of Real-Time Analytics
- Traditional analytics often relies on historical data, providing a look at what has already happened. Integration of real-time analytics shifts this paradigm by using live data streams to provide up-to-the-minute insights.
- Immediate Decision-Making: For businesses where every second counts—such as e-commerce, finance, or logistics—real-time analytics is invaluable. A retail store can instantly see which products are flying off the shelves and adjust inventory or pricing on the fly. A financial institution can monitor market trends in real time to make split-second trading decisions.
- Enhanced Customer Experience: By analyzing real-time data from customer interactions (e.g., website clicks, shopping cart activity), businesses can personalize the user experience in the moment, such as offering a relevant discount just as a customer is about to abandon their cart.
- IoT and Data Streams: The proliferation of IoT devices (like smart sensors and connected cars) is generating continuous data streams. Real-time analytics tools are essential for processing this data and extracting timely, actionable insights.
Final Recommendations
Ultimately, a tool is only as good as the people using it. Simply having access to data analytics platforms won't guarantee success. The most impactful and sustainable strategy is to build a company culture where data is a core part of the decision-making process at every level.
- Encourage Data Literacy: This means empowering every employee—from the marketing associate to the CEO—to understand basic data concepts and use data to support their arguments. Provide training, encourage curiosity, and celebrate when team members use data to solve a problem or identify a new opportunity.
- Prioritize Action Over Analysis: The goal of analysis is not to produce beautiful reports, but to drive meaningful action. Your final step should always be to implement the insights and measure the results. This completes the loop and demonstrates the true value of your efforts.
- Start Small, Scale Smart: Don't try to analyze everything at once. Begin with a single, high-impact business question and build your workflow around it. As you achieve success, you can gradually expand your data collection, invest in more powerful tools, and tackle more complex challenges. By focusing on these principles, you can turn your raw data into a continuous source of competitive advantage, making your business more efficient, responsive, and ultimately, more profitable.
Turn Your Raw Data into Real Business Growth!
Don’t let your data just sit in spreadsheets, learn how to transform it into actionable insights that drive smart decisions. Whether you’re a student, young professional, or business owner, mastering this workflow can give you a competitive edge.
Ready to Launch Your Tech Career?
Whether you're starting or upgrading your tech skills, you can begin your learning journey with us today.
Review Affordable Tech Course with us at ECR Academy We provide the hands-on, project-focused training you need to master tech skills like Digital Marketing, Web development, Data Analysis, Cybersecurity.
Build Comprehensive Digital Solutions with ECR Technology Services Limited Let us help you bring your brand, business, or idea online with professional digital solutions such as secure, responsive websites, robust mobile applications, high-impact digital marketing templates, and specialized Learning Management Systems (LMS).
Contact Us Today:
Frequently Asked Questions
1. Why is data cleaning important?
Because poor-quality data leads to inaccurate insights and wrong decisions.
2. What tools can I use for each step of the workflow?
Power BI, Tableau, SQL, Python, and Alteryx are commonly used.
3. Can small businesses adopt this workflow?
Yes—cloud-based, low-cost tools make it accessible to SMEs.
4. How do I ensure stakeholders act on insights?
Communicate findings in simple language with visual evidence.
5. What’s the biggest challenge in this process?
Turning insights into actions that deliver measurable business impact.

 Data Analysis
 0 comment
 18 Aug, 2025
SOPHIA OLISE
Data Analyst
Olise Sophia Amarachi is a passionate and purpose-driven data analyst and digital skills advocate based in Nigeria. With a strong foundation in Excel, Power BI, and SQL, she empowers others—especially young people and corps members—through practical training, tech mentorship, and values-based leadership. Sophia’s journey into data analysis began during her NYSC year in Abia State, where she committed herself to learning and growing from scratch. Today, she shares her knowledge through online classes, challenges, and hands-on projects, including dashboards and reports that translate complex data into clear insights.
0 comment